Hazel nut BB Strategy, volume base- lite versionHazel nut BB Strategy, volume base — lite version
Having knowledge and information in financial markets is only useful when a trader operates with a well-defined trading strategy. Trading strategies assist in capital management, profit-taking, and reducing potential losses.
This strategy is built upon the core principle of supply and demand dynamics. Alongside this foundation, one of the widely used technical tools — the Bollinger Bands — is employed to structure a framework for profit management and risk control.
In this strategy, the interaction of these tools is explained in detail. A key point to note is that for calculating buy and sell volumes, a lower timeframe function is used. When applied with a tick-level resolution, this provides the most precise measurement of buyer/seller flows. However, this comes with a limitation of reduced historical depth. Users should be aware of this trade-off: if precise tick-level data is required, shorter timeframes should be considered to extend historical coverage .
The strategy offers multiple configuration options. Nevertheless, it should be treated strictly as a supportive tool rather than a standalone trading system. Decisions must integrate personal analysis and other instruments. For example, in highly volatile assets with narrow ranges, it is recommended to adjust profit-taking and stop-loss percentages to smaller values.
◉ Volume Settings
• Buyer and seller volume (up/down volume) are requested from a lower timeframe, with an option to override the automatic resolution.
• A global lookback period is applied to calculate moving averages and cumulative sums of buy/sell/delta volumes.
• Ratios of buyers/sellers to total volume are derived both on the current bar and across the lookback window.
◉ Bollinger Band
• Bands are computed using configurable moving averages (SMA, EMA, RMA, WMA, VWMA).
• Inputs allow control of length, standard deviation multiplier, and offset.
• The basis, upper, and lower bands are plotted, with a shaded background between them.
◉ Progress & Proximity
• Relative position of the price to the Bollinger basis is expressed as percentages (qPlus/qMinus).
• “Near band” conditions are triggered when price progress toward the upper or lower band exceeds a user-defined threshold (%).
• A signed score (sScore) represents how far the close has moved above or below the basis relative to band width.
◉ Info Table
• Optional compact table summarizing:
• - Upper/lower band margins
• - Buyer/seller volumes with moving averages
• - Delta and cumulative delta
• - Buyer/seller ratios per bar and across the window
• - Money flow values (buy/sell/delta × price) for bar-level and summed periods
• The table is neutral-colored and resizable for different chart layouts.
◉ Zone Event Gate
• Tracks entry into and exit from “near band” zones.
• Arming logic: a side is armed when price enters a band proximity zone.
• Trigger logic: on exit, a trade event is generated if cumulative buyer or seller volume dominates over a configurable window.
◉ Trading Logic
• Orders are placed only on zone-exit events, conditional on volume dominance.
• Position sizing is defined as a fixed percentage of strategy equity.
• Long entries occur when leaving the lower zone with buyer dominance; short entries occur when leaving the upper zone with seller dominance.
◉ Exit Rules
• Open positions are managed by a strict priority sequence:
• 1. Stop-loss (% of entry price)
• 2. Take-profit (% of entry price)
• 3. Opposite-side event (zone exit with dominance in the other direction)
• Stop-loss and take-profit levels are configurable
◉ Notes
• This lite version is intended to demonstrate the interaction of Bollinger Bands and volume-based dominance logic.
• It provides a framework to observe how price reacts at band boundaries under varying buy/sell pressure, and how zone exits can be systematically converted into entry/exit signals.
When configuring this strategy, it is essential to carefully review the settings within the Strategy Tester. Ensure that the chosen parameters and historical data options are correctly aligned with the intended use. Accurate back testing depends on applying proper configurations for historical reference. The figure below illustrates sample result and configuration type.
Pesquisar nos scripts por "take profit"

Range Breakout StrategyAfter consecutive candle closes it creates a range, and if price breaks out of it it enters with fixed take profit.

RedFlagCounter-trend strategy
Condition to open a long position:
Buys if the price drops by a specified percentage from the previous candle’s close. Only one purchase can be made within a single candle.
Condition to close a position:
Places a separate individual closing limit order for each purchase, or uses one common take-profit order for the whole position.
⚠️ Attention : Stop-loss is not implemented in the current first version of the strategy.
Options description:
Drop_percent , % — Percentage drop in price from the From point
From — The reference point on the closed candle from which the Drop_percent is calculated (Open, Close, High, Low)
Tp , % — Take-profit level as a percentage
Count — Number of allowed additional purchases (scaling in)
Each_tp — Mode switch:
True — a separate take-profit is placed for each purchase
False — one common take-profit is placed based on the average entry price of the position
Penguin Volatility State StrategyThe Penguin Volatility State Strategy is a comprehensive technical analysis framework designed to identify the underlying "state" or "regime" of the market. Instead of just providing simple buy or sell signals, its primary goal is to classify the market into one of four distinct states by combining trend, momentum, and volatility analysis.
The core idea is to trade only when these three elements align, focusing on periods of volatility expansion (a "squeeze breakout") that occur in the direction of a confirmed trend and are supported by strong momentum.
Key Components
The strategy is built upon two main engines
The Volatility Engine (Bollinger Bands vs. Keltner Channels)
This engine detects periods of rapidly increasing volatility. It measures the percentage difference (diff) between the upper bands of Bollinger Bands (which are based on standard deviation) and Keltner Channels (based on Average True Range). During a volatility "squeeze," both bands are close. When price breaks out, the Bollinger Band expands much faster than the Keltner Channel, causing the diff value to become positive. A positive diff signals a volatility breakout, which is the moment the strategy becomes active.
The Trend & Momentum Engine (Multi-EMA System)
This engine determines the market's direction and strength. It uses:
A Fast EMA (e.g., 12-period) and a Slow EMA (e.g., 26-period): The crossover of these two moving averages defines the primary, underlying trend (similar to a MACD).
An Ultra-Fast EMA (e.g., 2-period of ohlc4): This is used to measure the immediate, short-term momentum of the price.
The Four Market States
By combining the Trend and Momentum engines, the strategy categorizes the market into four visually distinct states, represented by the chart's background color. This is the most crucial aspect of the system.
💚 Green State: Strong Bullish
The primary trend is UP (Fast EMA > Slow EMA) AND the immediate momentum is STRONG (Price > Fast EMA).
Interpretation: This represents a healthy, robust uptrend where both the underlying trend and short-term price action are aligned. It is considered the safest condition for taking long positions.
❤️ Red State: Strong Bearish
Condition: The primary trend is DOWN (Fast EMA < Slow EMA) AND the immediate momentum is WEAK (Price < Fast EMA).
Interpretation: This represents a strong, confirmed downtrend. It is considered the safest condition for taking short positions.
💛 Yellow State: Weakening Bullish / Pullback
Condition: The primary trend is UP (Fast EMA > Slow EMA) BUT the immediate momentum is WEAK (Price < Fast EMA).
Interpretation: This is a critical warning signal for bulls. While the larger trend is still up, the short-term price action is showing weakness. This could be a minor pullback, a period of consolidation, or the very beginning of a trend reversal. Caution is advised.
💙 Blue State: Weakening Bearish / Relief Rally
Condition: The primary trend is DOWN (Fast EMA < Slow EMA) BUT the immediate momentum is STRONG (Price > Fast EMA).
Interpretation: This signals that a downtrend is losing steam. It often represents a short-covering rally (a "bear market rally") or the first potential sign of a market bottom. Bears should be cautious and consider taking profits.
How the Strategy Functions
The strategy uses these four states as its foundation for making trading decisions. The entry and exit arrows (Long, Short, Close) are generated based on a set of rules that can be customized by the user. For instance, a trader can configure the strategy to
Only take long trades during the Green State.
Require a confirmed volatility breakout (diff > 0) before entering a trade.
Use the "RSI on Diff" indicator to ensure that the breakout is supported by accelerating momentum.
Summary
In essence, the Penguin Volatility State Strategy provides a powerful "dashboard" for viewing the market. It moves beyond simple indicators to offer a contextual understanding of price action. By waiting for the alignment of Trend (the State), Volatility (the Breakout), and Momentum (the Acceleration), it helps traders to identify higher-probability setups and, just as importantly, to know when it is better to stay out of the market.
License / disclaimer
© waranyu.trkm — MIT License. Educational use only; not financial advice.

AI-JX Strategy### 🤖 Core Features
AI-JX v3.3 is an AI-powered comprehensive trading strategy system developed with PineScript v6, integrating multiple advanced technical analysis tools and machine learning algorithms.
### 📊 Main Functional Modules 1. AI Learning System
- Adaptive Parameter Optimization : Automatically learns and adjusts trading parameters
- Three Strategy Modes : Conservative (ranging markets), Aggressive (trending markets), Balanced (universal)
- Dynamic Weight Adjustment : Intelligently allocates weights to different strategies based on market conditions
- Learning Memory Mechanism : Records historical trading data for continuous strategy optimization 2. Technical Indicator System
- SuperTrend Indicator : ATR-based trend following system
- Heikin Ashi Smoothing : Reduces market noise for clearer trend signals
- Standard Deviation Channels : Multi-level support and resistance analysis
- Trend Distribution Profile : Visualizes price distribution and trend strength
- Multi-Timeframe Analysis : Comprehensive analysis across 5m, 15m, and 1h timeframes 3. Intelligent Signal Generation
- Traditional Signals : Classic buy/sell signals based on SuperTrend
- AI Smart Signals : Comprehensive scoring system combining RSI, MACD, and ATR
- False Breakout Detection : Identifies and filters fake breakout signals
- Price Confirmation Mechanism : Ensures signal validity and reliability 4. Risk Management System
- Dynamic Stop Loss/Take Profit : Long 3% TP/1.5% SL, Short 2:1 risk-reward ratio
- Slippage Monitoring : Real-time market slippage risk assessment
- Volatility Filtering : Adjusts trading strategy based on ATR
- Position Management : Smart capital allocation and risk control 5. Visualization Panels
- Statistics Panel : Displays key data like trade count, win rate, current strategy
- AI Learning Panel : Shows strategy weights and learning progress
- Prediction Panel : Real-time AI analysis and trading recommendations
- Chart Markers : Clear buy/sell signals and trend line displays 6. Alert System
- Multiple Alert Types : Buy, sell, take profit, and stop loss notifications
- Personalized Messages : Fun "WangWang" themed alert messages
- Real-time Notifications : Precise alerts with maximum one per bar frequency
### 🎯 Key Advantages
- AI-Driven : Machine learning optimization for better performance
- Multi-Strategy : Adapts to different market conditions automatically
- Risk-Controlled : Comprehensive risk management with dynamic adjustments
- User-Friendly : Intuitive interface with detailed visualization panels
- Highly Customizable : Extensive parameter settings for different trading styles
RSI Momentum Trend MM with Risk Per Trade [MTF]This is a comprehensive and highly customizable trend-following strategy based on RSI momentum. The core logic identifies strong directional moves when the RSI crosses user-defined thresholds, combined with an EMA trend confirmation. It is designed for traders who want granular control over their strategy's parameters, from signal generation to risk management and exit logic.
This script evolves a simple concept into a powerful backtesting tool, allowing you to test various money management and trade management theories across different timeframes.
Key Features
- RSI Momentum Signals: Uses RSI crosses above a "Positive" level or below a "Negative" level to generate trend signals. An EMA filter ensures entries align with the immediate trend.
- Multi-Timeframe (MTF) Analysis: The core RSI and EMA signals can be calculated on a higher timeframe (e.g., using 4H signals to trade on a 1H chart) to align trades with the larger trend. This feature helps to reduce noise and improve signal quality.
Advanced Money Management
- Risk per Trade %: Calculate position size based on a fixed percentage of equity you want to risk per trade.
- Full Equity: A more aggressive option to open each position with 100% of the available strategy equity.
Flexible Exit Logic: Choose from three distinct exit strategies to match your trading style
- Percentage (%) Based: Set a fixed Stop Loss and Take Profit as a percentage of the entry price.
- ATR Multiplier: Base your Stop Loss and Take Profit on the Average True Range (ATR), making your exits adaptive to market volatility.
- Trend Reversal: A true trend-following mode. A long position is held until an opposite "Negative" signal appears, and a short position is held until a "Positive" signal appears. This allows you to "let your winners run."
Backtest Date Range Filter: Easily configure a start and end date to backtest the strategy's performance during specific market periods (e.g., bull markets, bear markets, or high-volatility periods).
How to Use
RSI Settings
- Higher Timeframe: Set the timeframe for signal calculation. This must be higher than your chart's timeframe.
- RSI Length, Positive above, Negative below: Configure the core parameters for the RSI signals.
Money Management
Position Sizing Mode
- Choose "Risk per Trade" to use the Risk per Trade (%) input for precise risk control.
- Choose "Full Equity" to use 100% of your capital for each trade.
- Risk per Trade (%): Define the percentage of your equity to risk on a single trade (only works with the corresponding sizing mode).
SL/TP Calculation Mode
Select your preferred exit method from the dropdown. The strategy will automatically use the relevant inputs (e.g., % values, ATR Multiplier values, or the trend reversal logic).
Backtest Period Settings
Use the Start Date and End Date inputs to isolate a specific period for your backtest analysis.
License & Disclaimer
© waranyu.trkm — MIT License.
This script is for educational purposes only and should not be considered financial advice. Trading involves significant risk, and past performance is not indicative of future results. Always conduct your own research and risk assessment before making any trading decisions.

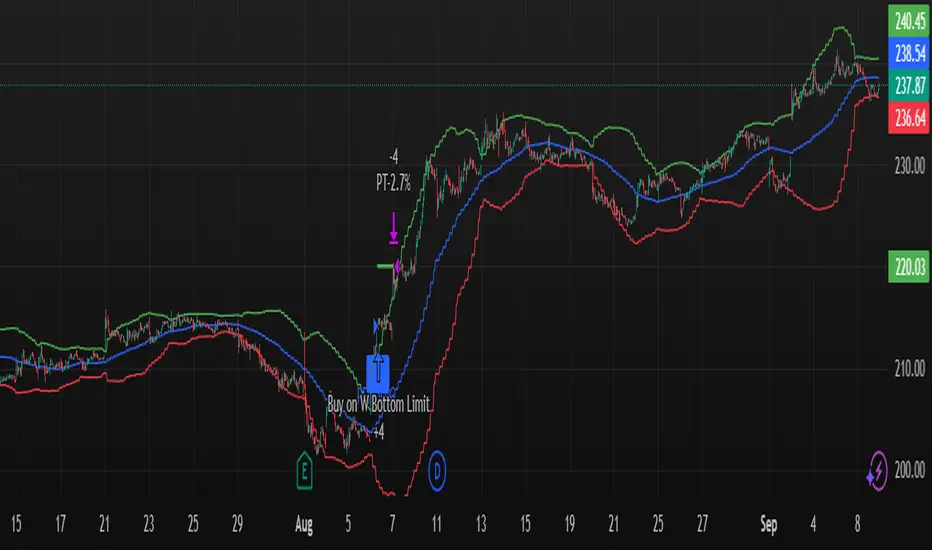
W Bottom Reversal Strategy W Bottom Reversal Strategy (15m-close entries; intrabar TP; daily MACD exit; JSON alerts v49.3-expire2)
Overview
A precision reversal strategy designed for 15-minute charts on liquid symbols. It detects a capitulation-and-stabilization “W” base using 1-hour (1H) context, confirms momentum improvement, then enters only on bar close to avoid early/“ghost” signals. Exits combine a fast intrabar take-profit (~2.7%) with a daily MACD risk-off exit that closes positions when higher-timeframe momentum turns against the setup.
How it works (high-level, matching code)
1H volatility + oversold gate (arming)
Compute 1H Bollinger-style bands (basis = SMA(close, bbLength=20), stdev multiplier bbMult=2.0).
Arm the setup when a 1H bar closes with price < 1H lower band and 1H RSI( rsiLength=14 ) < rsiThreshold (default 20.0).
1H momentum flip → pending entry
When a new 1H bar closes and 1H MACD line (EMA12−EMA26) crosses above 0 while armed and flat, set an entryPending flag.
This does not enter yet—it prepares a confirmed, bar-close entry on the lower timeframe.
Bar-close execution on the chart timeframe (15m)
On the next 15m bar close (or within N bars, see below) and still flat, fire the entry using a limit order at close × (1 − 0.00001) (≈ 0.001% below close) to reduce slippage and maintain chart/alert alignment.
Anti-late filter (no stale triggers)
If the pending entry doesn’t trigger within N chart bars (input: “Pending entry valid for N chart bars”, default 1, range 1–8), it expires and the arm state resets. This prevents late fills long after the 1H confirmation.
Exit logic
Primary: Standing intrabar take-profit at +2.7% from the average entry price (managed via strategy.exit limit).
Risk-off: On daily bar close, if Daily MACD line (EMA12−EMA26) crosses under 0, close the position (flat on daily momentum flip).
Default Properties (used for this publication)
Timeframe: 15m (with 1H and Daily higher-timeframe confirmations via request.security)
Initial capital: $10,000
Position sizing: Percent of equity = 10% per trade (enters only when flat; no stacking while in a position)
Commission: 0.05% per side
Slippage: Recommend 1 tick in Strategy Properties for realistic fills
Inputs exposed:
BB Length: 20 • BB Multiplier: 2.0
RSI Length: 14 • RSI Threshold: 20.0
MACD: Short 12, Long 26, Signal 9 (signal kept for compatibility; logic uses MACD line vs 0)
Pending entry valid for N chart bars: default 1 (1–8)
Execution behavior (per code):
calc_on_every_tick = false (evaluates on bar close)
process_orders_on_close = true (orders placed at bar close)
Limit entry at close −0.001%
Intrabar TP (2.7%)
Daily risk-off exit on MACD<0 at daily bar close
Alerts (exact behavior in code)
Uses alert() function calls with standardized JSON.
Set your alert to “Only alert() function calls” and “Once per bar close.”
Two events are emitted:
LONG_CONFIRMED on entry fire (15m bar close)
EXIT_CONFIRMED_DAILY_MACD on daily MACD<0 (daily bar close)
JSON fields include: event, version ("v49.3-expire2"), symbol, interval, price, and time.
How to use
Apply on liquid tickers (tight spreads, healthy volume).
Keep defaults initially; run across a broad, liquid watchlist to gather a proper sample.
For automation, route bar-close alerts to your executor; confirm broker lot/route settings and that limit orders at close −0.001% are acceptable.
Expect fewer signals in powerful trends; the daily risk-off helps cut failed bases.
Methodology & expectations (results transparency)
Evaluate on a dataset yielding 100+ trades before drawing conclusions.
Keep commission & slippage enabled (see defaults).
Risk sizing: With 10% of equity per trade and flat-to-flat entries, exposure aligns with typical 5–10% guidance.
No performance guarantees—outcomes depend on symbol selection, volatility regime, news, and execution quality.
Originality & value (vendor justification)
While it uses familiar building blocks (BB/RSI/MACD), the edge comes from the 1H volatility + oversold arming, 1H momentum flip, strict 15m bar-close limit execution, and the N-bar pending expiry that prevents stale triggers—paired with a dual-exit design (intrabar TP + daily risk-off). The focus is on reducing premature fills, keeping alerts 1:1 with chart marks, and capturing the first impulse out of a W-base.
Disclaimers
For educational purposes only; not financial advice. Paper-test first. Verify alerts, fills, and symbol liquidity with your broker before live use.
Changelog: v49.3-expire2 — Bar-close limit entries; anti-late pending window; standardized JSON alerts; intrabar 2.7% TP; daily MACD risk-off exit.
Lavender Multi-Signal Momentum StrategyOverview
The Lavender strategy is a sophisticated momentum-based trading system specifically optimized for Tesla (TSLA) on the 15-minute timeframe. It combines multiple technical signals to identify high-probability long entries during strong trending conditions.
Key Features
🎯 Multi-Signal Entry System
The strategy uses 4 distinct signal types that can be enabled/disabled individually:
Supertrend Pullback (Default: ON)
Identifies pullbacks in uptrends using Supertrend (ATR: 9, Factor: 0.5)
Enters when price retests EMA9-20 zone during bullish Supertrend
Donchian Breakout + Z-Score Momentum (Default: ON)
53-period Donchian channel breakouts
Combined with 35-period Z-Score momentum filter
Only triggers with positive momentum confirmation
Keltner Squeeze Expansion (Default: OFF)
Detects volatility squeeze conditions
Enters on breakout above Keltner Channel after compression
Opening Range Breakout (ORB) (Default: ON)
Tracks first hour range (9:30-10:30 AM)
Triggers on breakout above opening range high
🧭 Trend Regime Filter
EMA Trend Filter: 20 EMA > 100 EMA (Default: ON)
ADX Strength Filter: ADX > 22 with 15/13 smoothing (Default: ON)
Only trades when both trend conditions align
💵 Advanced Risk Management
Risk per Trade: 2.0% of capital (Default)
ATR-Based Stop Loss: 15-period ATR × 1.6 multiplier
Risk/Reward Ratio: 4:1 (Default)
Position Sizing: Automatic based on stop distance
Capital Options: Dynamic equity or fixed capital ($200,000 default)
⚙️ Execution Control
Candle Close Entries: Prevents intrabar noise (Default: ON)
Candle Close Exits: Stop loss and take profit only at bar close (Default: ON)
Trading Session: 9:00 AM - 4:00 PM (Default)
Trading Days: Monday-Saturday (Default: 123456)
Default Settings Summary
ParameterDefault ValuePurposeRisk per Trade2.0%Capital risk percentageATR Length15Stop loss calculationATR Multiplier1.6Stop distance factorRisk/Reward4.0Take profit multiplierEMA Fast20Short-term trendEMA Slow100Long-term trendADX Threshold22Minimum trend strengthMin Signals Required1Entry trigger thresholdInitial Capital$200,000Backtesting capital
How It Works
Trend Confirmation: Checks EMA alignment and ADX strength
Signal Generation: Scans for active momentum signals
Entry Execution: Enters when minimum signal threshold is met
Risk Management: Calculates position size based on ATR stop
Exit Management: Manages trades with 4:1 risk/reward ratio
Best Use Cases
Tesla (TSLA) on 15-minute charts
Trending market conditions
Intraday momentum trading
Markets with clear directional bias
Visual Indicators
Blue Line: 100-period EMA (trend filter)
Green/Red Line: Supertrend indicator
Teal Line: Donchian channel high
Purple Triangles: Keltner breakout signals
Orange Arrows: Opening range breakouts
Green Dots: Combined entry signals
Red/Green Lines: Active stop loss and take profit levels
Risk Disclaimer
This strategy is optimized for Tesla's specific price behavior on 15-minute timeframes. Past performance does not guarantee future results. Always test thoroughly and manage risk appropriately.
Created by kevloewe - Specialized for TSLA 15M momentum trading

Mikey’s Strategy (AutoEMA+)
⚙️ Core Idea:
A long-only EMA crossover strategy that automatically selects the optimal EMA length (5–25) based on historical performance using a custom scoring system.
🎯 Entry Conditions:
Price crosses above the selected EMA.
(Optional) Price is above HTF EMA200 (higher timeframe trend).
(Optional) ADX is above a minimum threshold.
(Optional) Volume is above average × multiplier.
A cooldown period has passed since the last exit.
❌ Exit Condition:
Price closes fully below the EMA (current candle: high, low, and close all below),
and the previous candle was above or touched the EMA.
🧠 Auto EMA Selection Logic:
Scans EMAs in the range (e.g., 8–21) every N bars.
Scores each EMA based on:
Time price spent above the EMA
Respect for EMA (touches)
Trend consistency
Distance from EMA (when above)
Picks the EMA with the highest valid score, and updates only if it’s significantly better.
🛡️ Risk Management:
No pyramiding (1 position max).
Cooldown period after exit.
No hard stop loss or take profit.
📊 Visuals & Alerts:
Plots the selected EMA and optional HTF EMA200.
Entry markers and info label on the chart.
Alerts for valid entries and filtered signals.

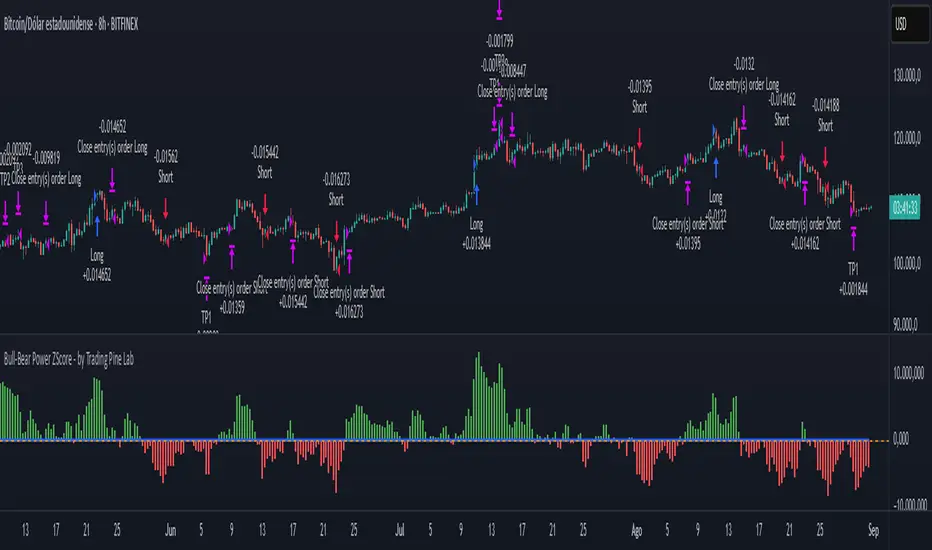
Bull-Bear Power ZScore - by Trading Pine Lab🇬🇧
The Bull-Bear Power ZScore Strategy is an advanced trading framework that integrates Bull-Bear Power (BBP) with a statistical Z-Score model.
BBP measures the relative strength of buyers vs. sellers against an EMA baseline, while the Z-Score standardizes this relationship to detect statistically significant breakouts.
This dual-layer approach provides early trend detection while reducing noise from raw momentum signals.
Entries are triggered when the Z-Score crosses above or below its threshold (long above +T, short below –T). Exits occur when the Z-Score crosses back to zero, ensuring trades close when momentum fades.
A dynamic multi-level take-profit system is integrated, using ATR-based targets (TP1, TP2, TP3) that automatically adapt to **volume context** (high/medium/low) and **percentile analysis** (distribution of price and volume).
This ensures profit targets stretch in strong environments and tighten in weaker conditions, optimizing both risk and reward.
All parameters are fully configurable:
-Bull-Bear Power Settings: EMA length, Z-Score length, Z-Score threshold.
-Take Profit Settings: enable/disable TP system, ATR period, TP1–TP3 multipliers, TP1–TP3 position sizes.
-Volume Analysis: volume MA period, high/medium/low multipliers, adjustment factors.
-Percentile Analysis: percentile lookback period, high/medium/low thresholds, adjustment factors.
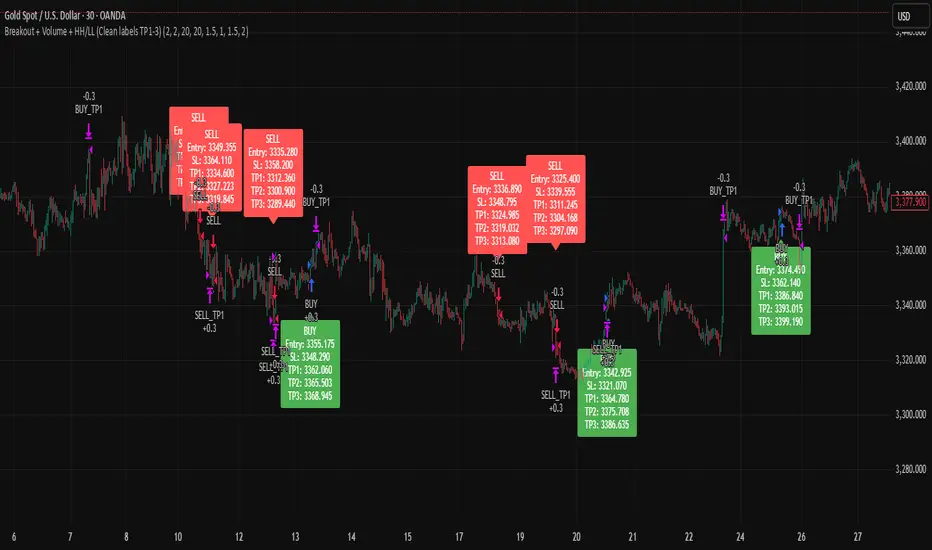
Breakout + Volume + HH/LL (Clean labels TP1-3)Breakout + Volume + HH/LL Strategy (Clean Labels)
This strategy combines breakout confirmation, volume strength, and market structure (Higher Highs / Lower Lows) to identify high-probability trade setups.
Breakout Filter: Uses a Donchian channel to detect price breakouts above resistance or below support.
Volume Confirmation: Requires volume to exceed the moving average of volume by a chosen multiplier, filtering out weak or false breakouts.
Market Structure: Long trades are only allowed if a Higher High (HH) has formed, and short trades only if a Lower Low (LL) has formed.
Trade Execution Rules:
For BUY trades: Entry at breakout, stop loss (SL) below the last pivot low, and three take profits (TP1–TP3) based on configurable risk-reward ratios.
For SELL trades: Entry at breakout, stop loss above the last pivot high, with TP1–TP3 levels set symmetrically below the entry.
Labels on Chart:
Each signal is marked with a clean label showing only:
Trade direction (BUY or SELL)
Entry price
Stop Loss
TP1, TP2, TP3
This makes the chart uncluttered while still providing all key trade information for execution or backtesting.
Intraday Alpha Pro - ORB + Trend/MomentumOverview
This is a pure intraday trading strategy designed for active traders seeking to capitalize on short-term price movements using two complementary modules: Opening Range Breakout (ORB) and Trend/Momentum. The strategy operates strictly within a user-defined trading session, automatically flattening all positions at session end to avoid overnight carry. It employs a points-based exit system with a trailing stop that activates only after the target is reached, ensuring disciplined risk management. Optional Martingale position sizing is included for users who prefer aggressive scaling after losses.Key Features Pure Intraday, No Carry: Trades are confined to a user-defined session (default: 9:15 AM–3:25 PM, Monday–Sunday). All positions are closed at session end.
Non-Repainting: Entries are evaluated only on confirmed bar closes (barstate.isconfirmed), ensuring no lookahead or repainting.
Dual Signal Modules: Opening Range Breakout (ORB): Captures breakouts above/below the high/low of a user-defined opening range (default: 9:15 AM–9:30 AM).
Trend/Momentum: Combines EMA (9/21) crossovers, RSI filters, volume confirmation, and an optional 200-period MA trend filter for robust trend-following signals.
Points-Based Exits: Uses fixed stop-loss (slPoints, default 16 points) and take-profit (tpPoints, default 32 points) distances. Once the take-profit level is reached, a trailing stop (trailDistPts, default 10 points) activates, ratcheting monotonically to lock in gains.
Martingale Sizing (Optional): Allows position size increases after losses (up to maxQtyInput) with a reset option after wins.
Cooldown Period: Prevents immediate re-entries after exits using a configurable cooldown (cooldownBars).
Flexible Inputs: Toggle long/short entries, enable/disable ORB or Trend/Momentum modules, and customize all parameters (e.g., MA lengths, RSI thresholds, volume multiplier).
Visuals & Alerts: Plots ORB high/low lines and moving averages (9, 21, 200). Includes alerts for long/short entries and end-of-day flattening.
How It Works Session Management: Trades only within the specified tradeSes (default: 9:15 AM–3:25 PM). The ORB module uses a separate orbSes (default: 9:15 AM–9:30 AM) to calculate breakout levels. Positions are closed automatically at session end.
Entry Conditions: ORB: Long when price closes above the ORB high after the ORB session ends; short when price closes below the ORB low.
Trend/Momentum: Long on fast MA (default EMA 9) crossing above slow MA (default EMA 21), with RSI above rsiBuy (default 55), volume exceeding volMult (default 1.5x prior bar), and price above the 200-period MA (if enabled). Shorts use the inverse.
Exit Logic: Stop-loss is set at entry price ± slPoints.
Take-profit is monitored using a running high/low since entry. Once price moves tpPoints in profit, the stop trails at trailDistPts behind the current price, adjusting only in the favorable direction (never loosening).
Exits use strategy.exit with stop only (no limit orders).
Position Sizing: Default size is baseQtyInput (minimum 1 contract). With useMartingale enabled, size increases by martingaleFactor after a loss, capped at maxQtyInput. If resetOnWin is true, size resets to baseQtyInput after a winning trade.
Cooldown: After an exit, no new trades are allowed for cooldownBars to prevent overtrading.
Futures-Safe Volume: Volume filter accommodates markets with missing or zero volume data (e.g., futures), ensuring signals aren’t blocked unnecessarily.
Inputs Trading Session: tradeSes (e.g., "0915-1525:1234567") and orbSes (e.g., "0915-0930:1234567").
Toggles: enableLong, enableShort, useORB, useTrendMom, useTrendFilter (200-MA).
Trend/Momentum: maType (EMA/SMA), fastLen (9), slowLen (21), trendLen (200), rsiLen (14), rsiBuy (55), rsiSell (45), volMult (1.5).
Exits: slPoints (16), tpPoints (32), trailDistPts (10).
Martingale: useMartingale, baseQtyInput, maxQtyInput, martingaleFactor, resetOnWin.
Cooldown: cooldownBars (1).
Legacy (Ignored): tp1RR, tp2RR, tp3RR, tp1Pct, tp2Pct, tp3Pct, stepTrail for backward compatibility.
Usage Notes Best suited for liquid, intraday markets (e.g., futures like ES, NQ, or forex pairs).
Adjust slPoints, tpPoints, and trailDistPts to match instrument volatility.
Use useMartingale cautiously, as it increases risk after losses.
Ensure tradeSes and orbSes align with your market’s trading hours.
Alerts can be set for long/short entries and EOD flattening.
The strategy avoids lookahead and repainting, ensuring reliability in live trading.
Risk Warning
Trading involves significant risk. Backtest thoroughly and use appropriate risk management. The Martingale option can amplify losses if not carefully monitored. Past performance is not indicative of future results.

Script_Algo - Fibo Correction Strategy🔹 Core Concept
The strategy is built on combining Fibonacci retracement levels, candlestick pattern confirmation, and trend filtering for trade selection. It performs well on the 1-hour timeframe across many cryptocurrency pairs. Particularly on LINKUSDT over the past year and a half, despite the not very optimal 1:1 risk/reward ratio.
The logic is simple: after a strong impulse move, the price often retraces to key Fibonacci levels (specifically, the 61.8% level). If a confirming candlestick (pattern) appears at this moment, the strategy looks for an entry in the direction of the main trend.
🔹 Indicators Used in the Strategy
ATR (Average True Range) — Used to calculate the stop-loss and take-profit levels.
EMA (9 and 21) — Additional moving averages for assessing the direction of movement (not directly used in entry conditions, but the logic can be expanded to include them).
SMA (Trend Filter, 20 by default) — The trend direction filter. Trades are only opened in its direction.
Fibonacci Levels — The 61.8% retracement level is calculated based on the high and low of the previous candle.
🔹 Entry Conditions
🟢 Long (Buy):
Previous Candle:
Must be green (close higher than open).
Must have a body not smaller than a specified minimum.
The upper wick must not exceed 30% of the body size.
→ This filters out "weak" or "indecisive" candles.
Current Candle:
Price touches or breaches the Fibonacci 61.8% retracement level from the previous range.
Closes above this level.
Closes above the Trend Filter (SMA) line.
A position is opened only if there are no other open trades at the moment.
🔴 Short (Sell):
Previous Candle:
Must be red (close lower than open).
Must have a body not smaller than a specified minimum.
The lower wick must not exceed 30% of the body size.
Current Candle:
Price touches or breaches the Fibonacci 61.8% retracement level from the previous range.
Closes below this level.
Closes below the Trend Filter (SMA) line.
A trade is opened only if there are no other open positions.
🔹 Risk Management
Stop-Loss = ATR × multiplier (default is 5).
Take-Profit = ATR × the same multiplier.
Thus, the default risk/reward ratio is 1:1, but it can be easily adjusted by changing the coefficient. Although, strangely enough, this ratio has shown the best results on some assets on the 1-hour timeframe.
🔹 Chart Visualization
Fibonacci level for Long — Green line with circles.
Fibonacci level for Short — Red line with circles.
Trend Filter line (SMA) — Blue.
🔹 Strengths of the Strategy
✅ Utilizes a proven market pattern — retracement to the 61.8% level.
✅ Further filters entries using trend and candlestick patterns.
✅ Simple, transparent logic that is easy to expand (e.g., adding other Fib levels, an EMA filter, etc.).
🔹 Limitations
⚠️ Performs better in trending markets; can generate false signals during ranging (sideways) conditions.
⚠️ The fixed 1:1 risk/reward ratio is not always optimal and could be refined.
⚠️ Performance depends on the selected timeframe and ATR parameters.
📌 Summary:
The strategy seeks corrective entries in the direction of the trend, confirmed by candlestick patterns. It is versatile and can be applied to forex pairs, cryptocurrencies, and stocks.
⚠️ Not financial advice. Pay close attention to risk management to avoid blowing your account. The strategy is not repainting — I have personally verified it through real testing — but it may not necessarily replicate the same results in the future, as the market is constantly changing. Test it, profit, and good luck to everyone!

MTF RSI + ADX + ATR SL/TP vivekDescription:
This strategy combines the power of multi-timeframe RSI filtering with ADX trend confirmation and ATR-based risk management to capture strong directional moves.
🔑 Entry Rules:
• Daily RSI > 60
• 4H RSI > 60
• 1H RSI > 60
• 10m RSI > 40
• ADX (current timeframe) > 20
When all conditions align, a long entry is triggered.
🛡 Risk Management:
• ATR-based Stop-Loss (customizable multiplier)
• Take-Profit defined as a Risk-Reward multiple of the ATR stop
🎯 Why this Strategy?
• Ensures alignment across higher timeframes before entering a trade
• Uses ADX to avoid choppy/range-bound markets
• Built-in ATR stop-loss & take-profit for disciplined risk control
• Fully customizable parameters
This strategy is designed for trend-following swing entries. It works best on liquid instruments such as indices, forex pairs, and large-cap stocks. Always optimize the parameters based on your preferred asset and timeframe.

MTF RSI + ADX + ATR SL/TPThis strategy combines the power of multi-timeframe RSI filtering with ADX trend confirmation and ATR-based risk management to capture strong directional moves.
🔑 Entry Rules:
• Daily RSI > 60
• 4H RSI > 60
• 1H RSI > 60
• 10m RSI > 40
• ADX (current timeframe) > 20
When all conditions align, a long entry is triggered.
🛡 Risk Management:
• ATR-based Stop-Loss (customizable multiplier)
• Take-Profit defined as a Risk-Reward multiple of the ATR stop
🎯 Why this Strategy?
• Ensures alignment across higher timeframes before entering a trade
• Uses ADX to avoid choppy/range-bound markets
• Built-in ATR stop-loss & take-profit for disciplined risk control
• Fully customizable parameters
This strategy is designed for trend-following swing entries. It works best on liquid instruments such as indices, forex pairs, and large-cap stocks. Always optimize the parameters based on your preferred asset and timeframe.

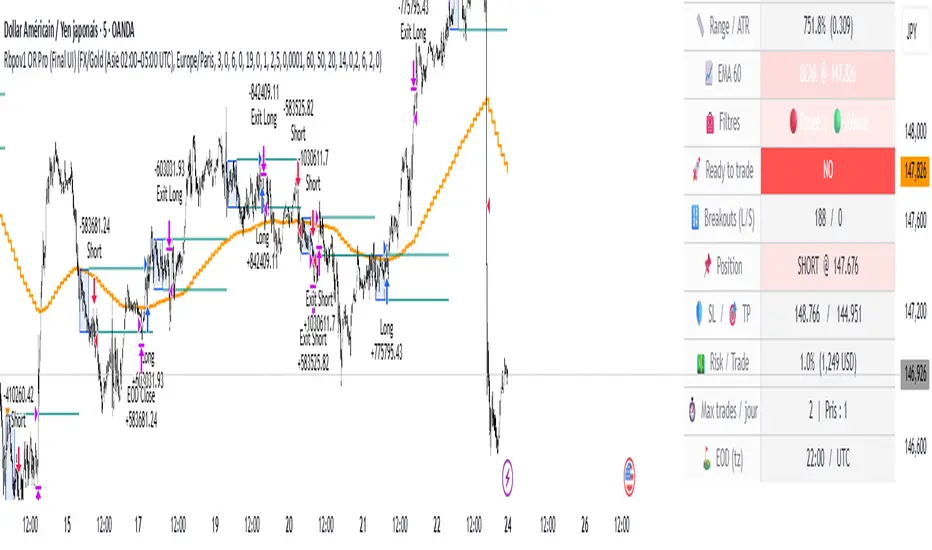
Rbpov1 – Opening Range Multi-Actifs Final📌 Strategy Bio – Rbpov1 Opening Range Pro
🎯 Core Concept
The Rbpov1 Opening Range Pro is an advanced algorithmic trading system built around the opening range breakout concept.
It is based on the observation that, after a period of consolidation (the opening range), markets often generate strong directional moves once the range is broken.
This strategy is designed to be multi-asset (Forex, indices, commodities, crypto) and multi-timeframe, with the following key principles:
A reference range (default: 03:00 → 06:00 UTC+2, customizable).
Trade entries are taken only after the range closes.
Smart filtering (trend, volatility, volume) to reduce false signals.
Strict risk management in USD, with Stop Loss and Take Profit defined in multiples of R.
Automatic end-of-day flat rule: all positions are closed by session end.
⚙️ Filters & Conditions
🔹 1. Trend Filter (EMA HTF)
A 21-period EMA is applied to a higher timeframe (default: H4).
If price is above EMA, only longs are allowed.
If price is below EMA, only shorts are allowed.
👉 This aligns intraday trades with the dominant trend.
🔹 2. Volatility Filter (ATR)
Uses a 14-period ATR to validate range conditions.
Opening range is valid only if:
Range > minATR × ATR
Range < maxATR × ATR
Default: minATR = 0.2, maxATR = 6.0.
👉 Filters out noise (tiny ranges) or overextended volatility.
🔹 3. Volume Filter (Optional)
Breakout candle must show higher volume than the average (default SMA 20).
Prevents low-liquidity breakouts.
🔹 4. Session & Trading Rules
No trades during weekends (Forex).
Maximum X trades per day (default: 2).
Positions are force-closed at EOD (default: 19:00 UTC+2).
💰 Risk Management
Dynamic position sizing in USD (capital × risk%).
Stop Loss automatically set at the opposite side of the range (with optional buffer).
Take Profit in multiples of R (default: 1.5R).
Equity-based recalculation ensures consistency as account grows.
📊 Key Benefits
✅ Professional and modular architecture.
✅ Works across Forex, indices, gold, and crypto.
✅ Smart filtering for cleaner signals.
✅ Robust and consistent risk management.
✅ Automatic end-of-day flattening (no overnight risk).
✅ Modern and visual dashboard interface for readability.
🏆 Use Cases
Forex (USD/JPY, EUR/USD, GBP/USD) → Asian session ranges.
Indices (NAS100, US30, DAX) → NYSE opening ranges.
Gold (XAU/USD) → Tokyo or pre-London ranges.
Crypto (BTC, ETH) → Tailored to volatility peaks.